We Engineer an Operational Backbone That Quietly Powers Your Business—Freeing Your Team to Focus on Real Growth, Not Busywork.
At Operion, we turn intricate workflows into effortless systems—saving you time, reducing friction, and driving growth with solutions your team will actually use.
Unify Your Data. Drive Growth Faster.
Say goodbye to messy spreadsheets, broken dashboards, and endless guesswork. Our custom BigQuery solutions bring real-time clarity to every role and department.
We partner with you to design, build, and refine dashboards that serve the exact metrics you need to thrive. Whether you're tracking marketing funnels, departmental KPIs, or company-wide performance, our data architecture keeps you informed and in control—without constant manual updates.

We Engineer an Operational Backbone That Quietly Powers Your Business—Freeing Your Team to Focus on Real Growth, Not Busywork.
At Operion, we turn intricate workflows into effortless systems—saving you time, reducing friction, and driving growth with solutions your team will actually use.


Unify Your Data.
Drive Growth Faster.
Say goodbye to messy spreadsheets, broken dashboards, and endless guesswork. Our custom BigQuery solutions bring real-time clarity to every role and department.
We partner with you to design, build, and refine dashboards that serve the exact metrics you need to thrive. Whether you're tracking marketing funnels, departmental KPIs, or company-wide performance, our data architecture keeps you informed and in control—without constant manual updates.
Why Your Data Feels Disconnected
Every day, you juggle data from CRMs, spreadsheets, ad platforms, and merchant accounts—none of which talk to each other. Reports break, metrics go stale, and critical insights slip through the cracks.
Instead of driving growth, you’re stuck patching together numbers you’re not even sure you can trust.
Unreliable KPI Sheets
They break so often that nobody trusts the numbers—giving everyone an excuse to ignore the data. Without a single, consistent source of truth, strategic decisions often hinge on guesswork rather than hard facts.
No Visibility on Real Performance
Without objective data to verify workload and results, you rely on managers’ word to gauge productivity—potentially missing who’s truly overworked, who’s coasting, and who’s excelling.
Equations on Spreadsheets,
Still No Clarity
You may have formulas and calculations in a shared sheet, but you’re still hunting down the right cells, tabs, or pivot tables—spending more time interpreting raw figures than taking action on them.
Manually Hunting for Trends
Spotting whether numbers are climbing or tanking requires you to build pivot tables, cross-reference old sheets, or repeat calculations—rather than clicking a single filter to see real-time patterns over time.
Overworked & Under-Informed
Departments feel perpetually stretched thin, but no one has the objective metrics to identify where tasks are piling up or how to rebalance workloads. Lacking real visibility, you’re forced to guess at solutions rather than resolve the root problem.
Sound familiar? These issues don’t just sap productivity—they hold back your entire operation, keeping you reactive instead of proactive in a rapidly changing market.
Sound familiar? These issues don’t just sap productivity—they hold back your entire operation, keeping you reactive instead of proactive in a rapidly changing market.
Unreliable KPI Sheets
They break so often that nobody trusts the numbers—giving everyone an excuse to ignore the data. Without a single, consistent source of truth, strategic decisions often hinge on guesswork rather than hard facts.
No Visibility on Real Performance
Without objective data to verify workload and results, you rely on managers’ word to gauge productivity—potentially missing who’s truly overworked, who’s coasting, and who’s excelling.
Equations on Spreadsheets,
Still No Clarity
You may have formulas and calculations in a shared sheet, but you’re still hunting down the right cells, tabs, or pivot tables—spending more time interpreting raw figures than taking action on them.
Manually Hunting for Trends
Spotting whether numbers are climbing or tanking requires you to build pivot tables, cross-reference old sheets, or repeat calculations—rather than clicking a single filter to see real-time patterns over time.
Overworked & Under-Informed
Departments feel perpetually stretched thin, but no one has the objective metrics to identify where tasks are piling up or how to rebalance workloads. Lacking real visibility, you’re forced to guess at solutions rather than resolve the root problem.

One Source of Truth—Built on BigQuery
The fastest way to stop guessing is to centralize every crucial data stream—CRM, project management, ad platforms, and beyond—into a single, secure platform. By leveraging BigQuery’s robust architecture, our custom builds unify your metrics and automate updates in real time.
Instead of flipping between spreadsheets and half-baked tools, you see exactly what you need, exactly when you need it.
True Data Unification
Pull in information from every corner of your business—from marketing funnels and merchant accounts to project timelines—so you can finally view everything in one place.
Automatic, Real-Time Updates
No more stale reports or “snapshot” data. With a BigQuery-driven system, your dashboards always reflect the latest metrics, keeping you nimble and informed.
Custom-Designed Dashboards
Instead of a one-size-fits-all template, we build role-specific views that highlight your actual priorities. Senior executives see big-picture KPIs, while teams get the granular details they need.
Click-to-Drill Functionality
Spot a problem in your top-line numbers? Instantly drill down to pinpoint the exact campaigns, tasks, or roles driving the issue—without juggling multiple platforms.
Universal Data Integration
Leveraging BigQuery’s robust API, we connect to any source of truth—from your CRM and project management system to merchant platforms and beyond—delivering unmatched accuracy and real-time insights that no tracking software can replicate.
With a single source of truth, you’re no longer spending half your time chasing down numbers or debating which spreadsheet is correct. Instead, you can focus on optimizing what matters most—leaving the data management to us.
What Makes Us Different?
Many operations teams focus on the “how” first, layering on extra procedures to tackle new challenges. At Operion, we start by understanding your team’s natural workflow, then design systems that feel effortless on the front end—yet harness powerful, behind-the-scenes complexity to give you, the owner, the data and insights you need.
The result? Fewer steps for your team, stronger buy-in across the board, and a foundation that’s built to scale.
Built Around People, Not Processes
We study how your team already works, then drop dashboards into that rhythm—no extra clicks, no new log‑ins to memorize.
Root‑Cause Data Engineering
We trace reporting gaps back to the source, building stable datastreams instead of patching spreadsheets. Clean data in, clear insights out.
Scale‑Ready Architecture
Schema design, warehousing, and API work happen day one, so adding a new data stream—or a whole new division—takes hours, not months.
Lean by Design
Every widget answers a real question or eliminates a manual task. If it doesn’t move a metric, it doesn’t make the cut.
Holistic Documentation
From SOPs and flowcharts to role-specific guides and video walkthroughs, we make sure your entire organization has a clear, accessible roadmap.

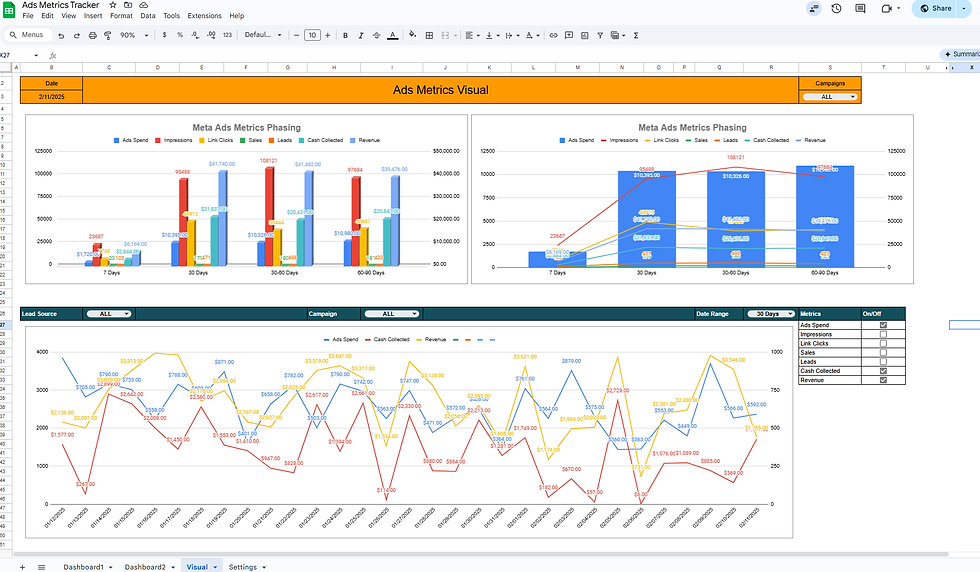
Explore What’s Possible—Then Let’s Tailor It to You
You might know some of the numbers you want to track—or maybe you have no idea where to start. Either way, here’s a glimpse of the dashboards we can build. These examples exist to spark ideas about what’s possible, and once we discover your exact needs, we’ll design every detail around your goals.
No one’s forced to implement everything you see here. Our role is to identify the metrics that matter most, then shape the data collection, organization, and KPIs to match the outcomes you’re aiming for.
👥 Team & Workflow Efficiency
Automated, Trigger-Based Time Tracking
Eliminate manual timers by detecting key workflow events automatically and exporting the data live into BigQuery. This provides precise visibility without adding extra steps to your team’s routine.
Media Buyer Testing Timelines
Track how long each media buyer takes to set up, launch, and complete creative tests. Identify bottlenecks, recognize top performers, and refine processes for higher profits through more successful tests.
Creative & Copy Performance Scoring
Evaluate each asset against the exact KPIs you define—whether leads, conversions, or ROI. By focusing on real results, you’ll know which creatives to scale and which ones to overhaul.
Automated Workload Balancing
Combine real-time time tracking with performance metrics to see who’s truly overworked and who’s just busy in name. Redistribute tasks intelligently based on objective data, not guesswork.
Role-Based Scoreboards
Inspire accountability and healthy competition with a live leaderboard displaying each team member’s output, productivity, or quality metrics—all updated in real time.
Automated Support Ticket Tracking
Stop guessing about response times and resolution rates. A real-time ticket dashboard pinpoints where customer satisfaction might be slipping, letting you fix issues fast.
Team & Workflow Efficiency
📈 Marketing & Creative Insights
On‑Time + Performance Index
Color‑coded leaderboard that blends delivery speed with win‑rate, spotlighting creators who beat the control and those who need coaching.
Production Time by Task Type
Auto‑tracked hours for videos, animations, ad copy, and more—pinpoint where process tweaks boost output.
True‑Source Marketing KPIs
Pull revenue and ROAS straight from payment and ad platforms, not pixel guesses, so every decision rests on hard data.
One‑Click Offer & Channel Filters
Instantly segment results by product, funnel, or network to see what’s scaling—or stalling.
Funnel Drop‑Off Heatmap
Visualize each step so you can fix leaks fast and lift conversion at the exact choke point.
Email Sequence Breakdown
Live open, click, and revenue stats in one view to optimize messaging and drive consistent engagement.
🏷️ Sales & Finance Visibility
Sales Team Dashboards
Pull in show-up rates, close rates, setting rates, and revenue per call—all in real time. Quickly see who’s excelling, who needs coaching, and where to adjust for maximum revenue.
Production Time Segmented by Task Type
Without manual logging, see exactly how long each person spends on tasks like new videos, animations, or ad headlines. Pinpoint which projects need process tweaks or extra training to boost efficiency.

How We Build Your Custom Dashboard in 30 Days
A high‑impact dashboard shouldn’t take quarters to launch. Our four‑week sprint moves you from scattered data to live insight fast.
We begin with an in-depth exploration of your goals and data sources—CRMs, project management tools, ad platforms, and more. Instead of just asking what metrics you want, we uncover the bigger picture. You’ll receive a clear Data Strategy Outline detailing exactly which sources and KPIs we’ll integrate into your custom dashboard—ensuring it aligns with your growth plans.
Next, we set up BigQuery and connect your core data streams so everything updates in real time. By the end, you’ll see a Skeleton Environment—proof that your data flows reliably, forming the foundation for your custom dashboard.
With your main data feeds connected, we build an Alpha Dashboard reflecting real metrics. It might not be pixel-perfect yet, but you’ll have hands-on access to genuine numbers. We validate accuracy together, ensuring we’ve captured the right metrics before finalizing the design.
Here, we refine layout, user experience, and any extra data connections—fine-tuning both visuals and functionality with role-based views or advanced drill-downs. By the end, you’ll have a Beta Dashboard that’s nearly ready for prime time.

Once polished, we deliver your Final Dashboard Suite—complete with SOPs, flowcharts, and role-specific video walkthroughs. We guide you through every feature so everyone feels confident from day one. After rollout, there’s a follow-up session for any lingering questions or fine-tuning.
In 30 days you shift from guesswork to decisions backed by real‑time data—no more spreadsheet gymnastics. Let’s start your sprint and unlock instant clarity.
Still Have Questions?
Still Have
Questions?


Uncover the High-Impact Wins You Never Knew Existed
We analyze your daily operations to uncover hidden opportunities for automation and efficiency. Instead of trial and error, you get immediate, proven solutions that eliminate headaches, boost growth, and keep your team focused on what truly matters.
.png)
Uncover the High-Impact Wins You Never Knew Existed
We analyze your daily operations to uncover hidden opportunities for automation and efficiency. Instead of trial and error, you get immediate, proven solutions that eliminate headaches, boost growth, and keep your team focused on what truly matters.
Team & Workflow Efficiency
Team & Workflow Efficiency
💪 Team & Workflow Efficiency
Trigger‑Based Time Tracking
Automatic timers fire from real workflow events—no manual clicks.
Media‑Buyer Timelines
Track setup‑to‑launch speed, reveal bottlenecks, and coach for higher ROAS.
Creative & Copy Scores
See which assets crush KPIs so winners scale and laggards get overhauled.
Smart Workload Balancing
Live view of who’s overloaded versus underutilized; reassign tasks fast.
Role‑Based Scoreboards
Real‑time leaderboards spark healthy competition and accountability.
Support Ticket Pulse
Response and resolution times in one view so customer issues never hide.